I just published this piece on Medium, but am also cross posting to my blog. If you want to make sure you receive all of the content I put out, make sure to subscribe to my email list.
There are many things that set Facebook apart from your (or my) products. That said, there’s really one thing that it all boils down to: retention. Facebook has developed a product that people use indefinitely. The rest of us? We have a long way to go. What should you be doing to close the gap? Keep track of your retention numbers.
Most of the people I speak with have no idea how many people they expect to be using their product in a year, even though they are the ones ultimately responsible for the progress. If you do have some sort of goal, did you just pick a big hairy number? Did someone throw out a goal for you? If I could give you one piece of advice, it would be to build a simple model so you know what to expect.
After watching Phil Libin’s talk on retention and cohorts, I thought it would be interesting to model out what different types of retention look like for a SaaS product. What would it look like if you acquire the same number of users over time, but don’t hang onto them? What would it look like if you had really good retention? What are the tipping points for user growth? I built a couple of simple Excel models, and the graphs were quite shocking to me.
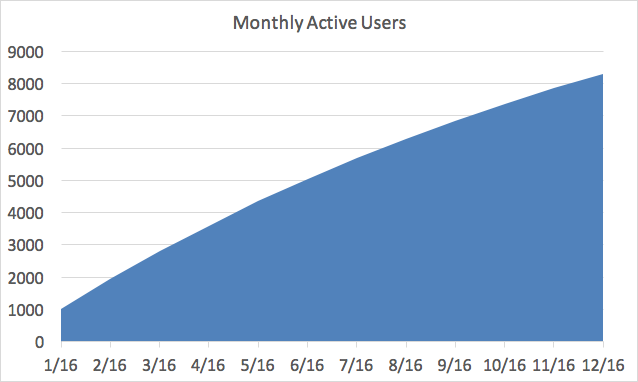
Let’s say you launch a new product, and as a good leader you track the people getting value from your product over time. Imagine it looks like this:
Congrats! You launched a new product to 1,000 users in January of 2016, and have grown it to over 8,000 monthly active users by the end of 2016. Your growth is slowing slightly, but you’re not too worried about it. Why should you be? You grew by 700% in 2016! That’s a cause for celebration.
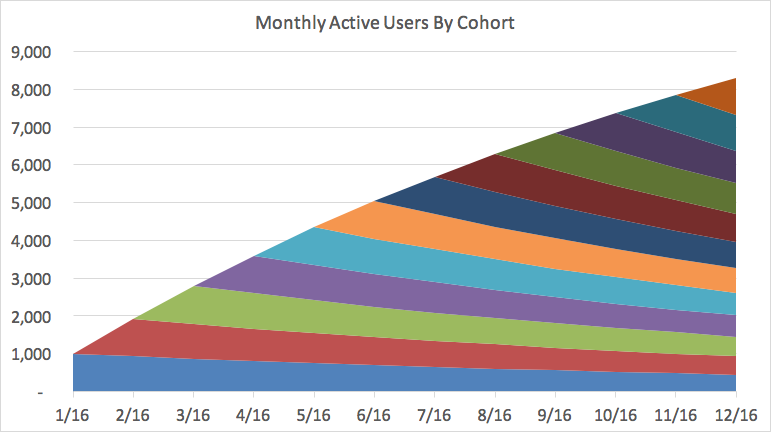
Lets look at this graph in a slightly different way, by the cohorts of people who start using your product each month. In the example above, I assumed that 1,000 new people sign up for your service each month, and that some of them stop using it over time. Those people might find a different tool, unplug from the internet, or get a virus and blame your tool for the havoc it caused. Either way, of the 1,000 people who start each month, some of them quit using your product in the months after they sign up. This is what the active users chart looks like breaking down the cohorts over time:
In the chart above, the blue shape on the bottom represents the 1,000 people who signed up in January, and then how many of them are using it throughout the year. By December 2016, only 450 of them are still around. The cohorts “stack” on top of one another to produce your total active users in a given month.
If you develop a great product like Facebook or Uber, there’s some percentage of cohorts that use your product forever. They’re addicted to it. Even if they stop using it at some point, they come back. Facebook would have a hard time growing to 1.6 billion monthly active users if a lot of people used it once or twice and then never used it again.
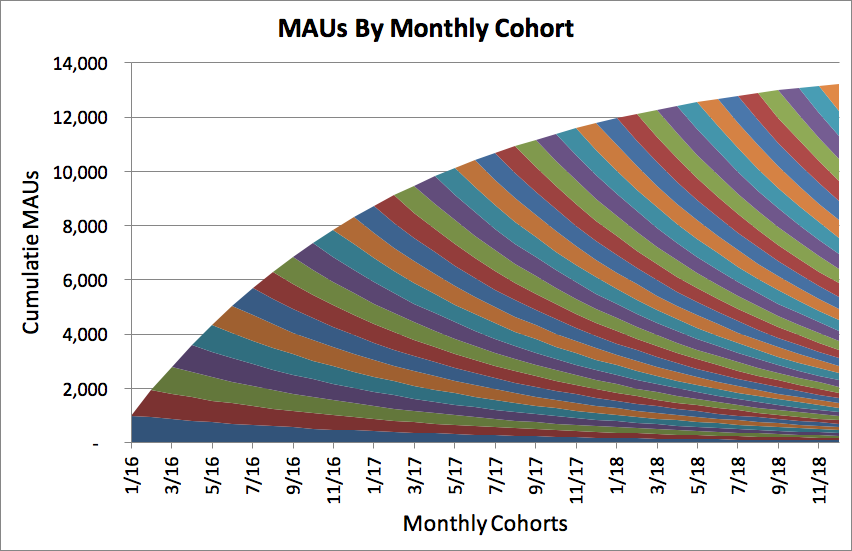
Let’s see what happens to your growth if you weren’t like Facebook, and you didn’t hang onto your cohorts for a long time like Facebook. Let’s say you continue to have 1,000 people sign up every month, but over time those people end up quitting your product. This is what the chart looks like past 2016:
By the end of 2018, you’ll only have 13,000 users of your product. You had 11,700 people at the end of 2017! Even though you grew 700% in 2016, you only grew 11% in 2018. The rate at which you’re growing is slowing significantly, even though you continue to add 1,000 users a month. You can see this visually in the bottom right of the chart, where all of the cohorts seem to stack on top of one another, but don’t add up to anything. You can’t even tell the cohorts apart, they just look like a colorful set of stripes. By the end of 2018, the new people you’re adding every month are barely replacing the people who abandon your product from all of your previous cohorts.
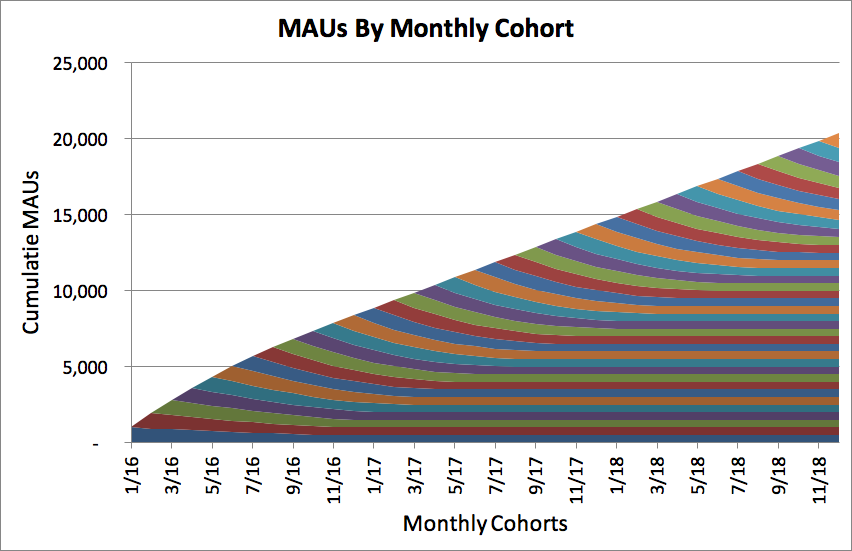
What does it look like if you are able to build a product where 50% of your cohorts end up loving you product and sticking around for a long time. What would that look like? Let’s update our graphs:
Wow! Instead of 13,000 users, you will have 20,000 users by the end of 2018. You can see the big difference between the graphs. In the bottom right you have rectangles that build on top of one another. You overall growth rate is still decreasing (as a percentage of your install base), but your total number of active users continues to increase. In the previous example your growth had basically stalled, in this graph you are growing at a constant rate. The best products in the world retain a large percentage of cohorts over time, and the bars are a large percentage of the initial cohort size.
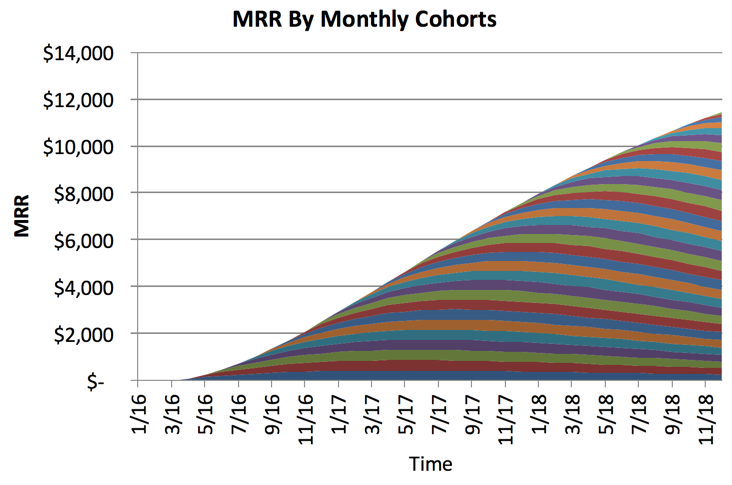
Up until this point, I’ve only been talking about retention of users. If you’re running a business you ultimately need to charge for your service (for example, a monthly subscription). Assume that a percentage of people will end up paying for your service, and that they slowly upgrade over time. If you can forecast how many people will be using your product, you should also be able to project how much money you’ll be making. Lets look at what your revenue looks like (again, broken down by cohort) when you have poor retention:
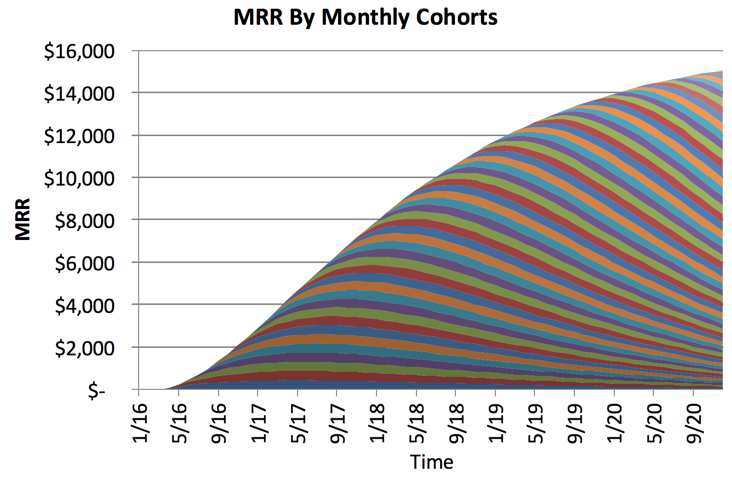
As your cohort sizes go to nothing, those people won’t keep paying for your product. This graph doesn’t look too bad, but what about if you look further into the future?
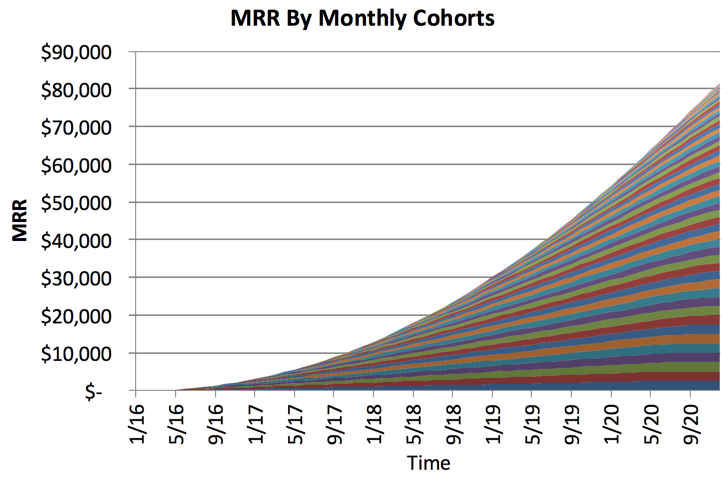
That doesn’t look good, you’re barely making any more money two years later. What about in the case where you have good retention? Assume that 10% of the long term users end up paying for your product, and they pay $50 / month. They don’t immediately upgrade — it happens slowly over time. What would that graph look like?
Holy crap! I like the slope of that line. In the bad retention example, you are making $15,000 / month in recurring revenue. What about in the good retention example? Over $80,000 / month.
Interested in playing with the different scenarios yourself? I uploaded my hypothetical data in an Excel file here, or in a Google Spreadsheet here. Google Spreadsheets is crappy for this kind of stuff, I’d recommend using Excel.


Recent Comments